Firstly this is meant for someone starting off with technicals. A beginner. So some of the concepts may be basic if you’re well versed with the subject. I consider these probably the best technical indicators for cryptocurrency trading.
This post is a follow up to an earlier post. So if you’re new here, I recommend you have a read of that.
Before we get into indicators, here’s a quick round up around technical analysis
- Price reflects everything. You don’t need to know what a crypto does or what a company does. The price tells you all and will reflect any development of the company.
- Prices move in trends. So there’s a pattern to moves on the charts
- History repeats itself. So future predictions of a price move can be made based on looking at the past.
Now, which there are different kinds of charts, I prefer two basic ones:
Line Chart – this basically plots the closing price (of each day or week or month……..)
Candlestick chart – this shows the price in the form of candles (bars) which show case the Open, High, Low and Close (of each day or week or month……..)
To keep it simple here, we’ll work with the line chart in this post.
So here’s three of the best technical indicators for cryptocurrency trading that can help you set off on the path to technical analysis:
1. Moving Averages
Let’s say you’ve given an exam consisting of 5 subjects – Mathematics, Science, English, History and Geography. You scored as follows, (to end up with an average score of 72)
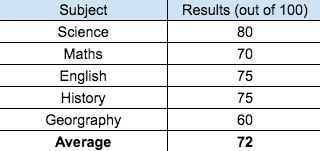
Let’s plot this on a chart,
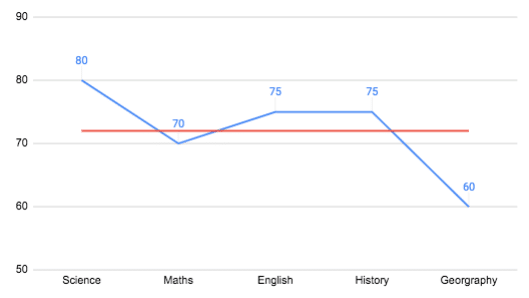
Now say you take another exam. This time in Literature, where you end up scoring 50 (yes, you’re bad in literature). So we now update the chart to accomodate the new subject,
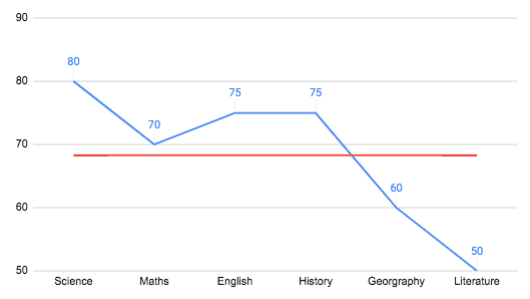
Your new average score now is 68.3. So the average line has moved from an earlier 72 to a 68.3. This is a moving average line.
For a cryptocurrency, this would be the average of closing price for each day. Given the price fluctuates every day, the moving average would change in the same manner.
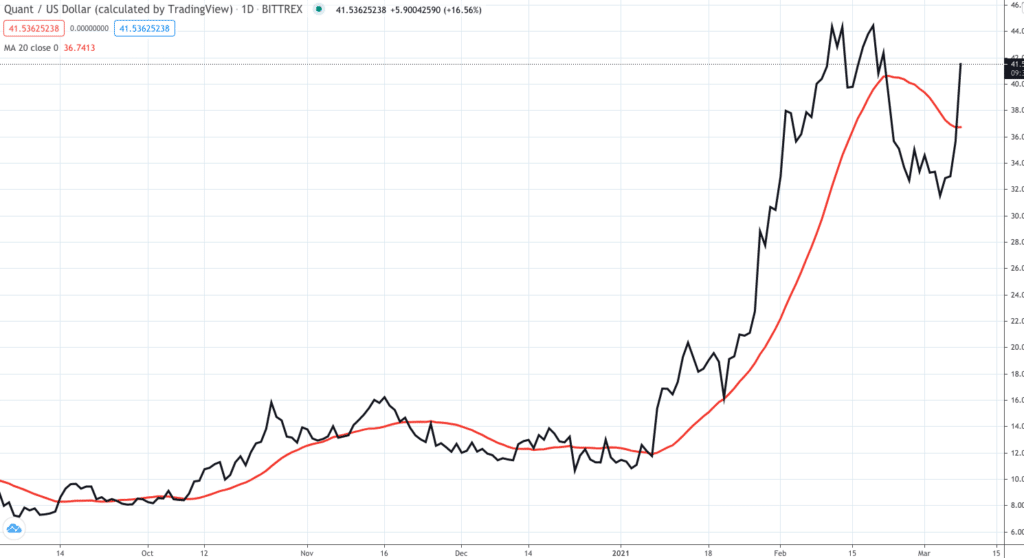
Let’s have a look at the moving average for Quant,
So,
- The dark black line is the daily (closing) price of Quant (a line chart)
- The red line is the moving average. Now you can use the average for any duration – 2 days, 5 days, 20 days, 200 days. By this I mean the latest value of the X-day average line is base on the past X days. So the latest value of the 20 day moving average is based on the average price of the last 20 days.
- I’ve used a 20 days moving average cause it serves as a decent indicator and can be a nice way to get a feel of this.
Try playing with some of your own cryptocurrencies and this indicator on Trading View. You’ll have to figure your way out a little here.
So what do I see in the chart above:
- The current price of Quant is trading above its 20 day moving average. What does this mean? This is a positive sign. Just like in your scorecard above, your scores in English, History, Science and Maths was above the average score, which is a good sign, so also when the price of a crypto is above its moving average, it means there’s a positive sentiment around the coin. (There are some technicalities on this. But this is enough for a fair understanding on this subject)
- The moving average can act as a support or resistance to the price. Go back a little on that chart above. See how the price fell around the 20th Jan )you’ll have to strain your eyes a little there), touched the moving average line and bounced back. So it took support off that line.
- Now, look at something more recent. Around the 20th of February, the price fell and breached that moving average. So it broke a support level, and there was a sharp kind of fall.
So, crossovers are one of the main moving average strategies. When the price crosses above or below a moving average, it signals a potential change in trend.
If you’re liking this content,
2. Bollinger Bands
Absolutely love this indicator. I’d covered this brienfly in the article on Parsiq. But here’s some more details. Let’s just have a look at an example. Using the chart of Vechain,
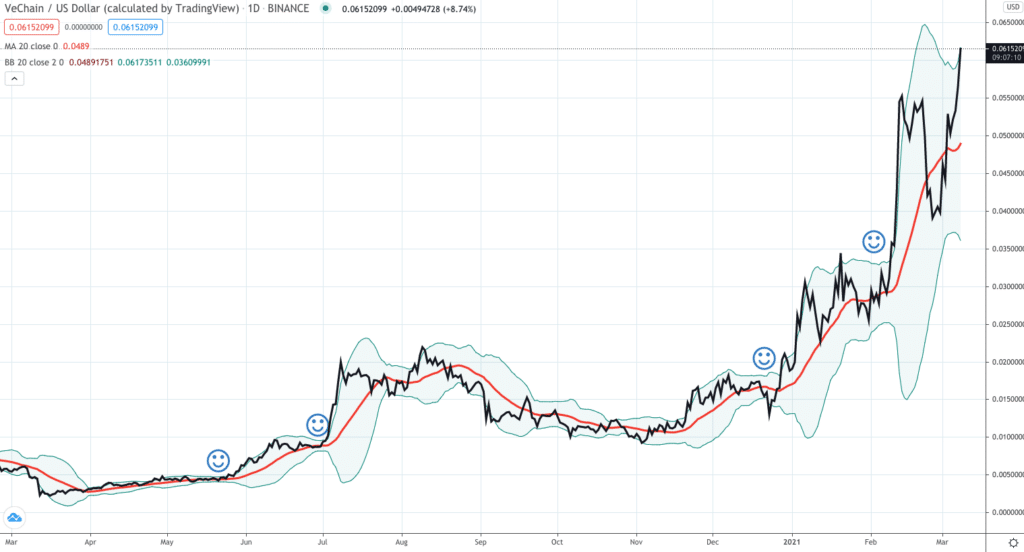
I know you’ll first see those smileys there. But ignore them for a while. What else do you see?
- A black line, which again is the price (just a simple line chart)
- A red line (which like previously is the moving average), which is a default part of this indicator
- Two green lines which form some kind of protection along the entire chart on either side of the black price line. These are the Bollinger Bands (named after the technical trader John Bollinger who developed them).
The bands, typically, are two standard deviations (if I lost you there, sorry about it. But for now, let’s just use it as a formula) above and below the 20-day simple moving average
How do you use this?
- When prices are closer to the top band, it means the price is high. When prices are closer to the lower band, it means the price is low.
- Here’s a set of official rules around the band. Have a read. It’s easy to follow and will give you some more idea.
- Now we come to those Smileys from earlier. Around those Smileys, as you see, the bands come close to each other – referred to as the squeeze. I think this works amazingly. Typically, this signifies an impending move – a sharp move up or down – but a break of a pattern. Check the chart again and see how the price moves within those bands (when they are close to each other). It’s typically sideways. Then comes a breakout, which is a sharp move in either direction (it’s largely been upwards in the chart above).
- You use this indicator with some others to get an understanding or try and predict which side the breakout will come. One such indicator is the next one we cover – RSI.
If you want to get into details on this, I suggest you refer to the official site itself.
3. Relative Strength Indicator (RSI)
Again I’m excluding the mathematics from this. So we’ll just go with the indicator here and how you can use it, rather than how it is developed. Let’s have a look at a chart for Cardano,
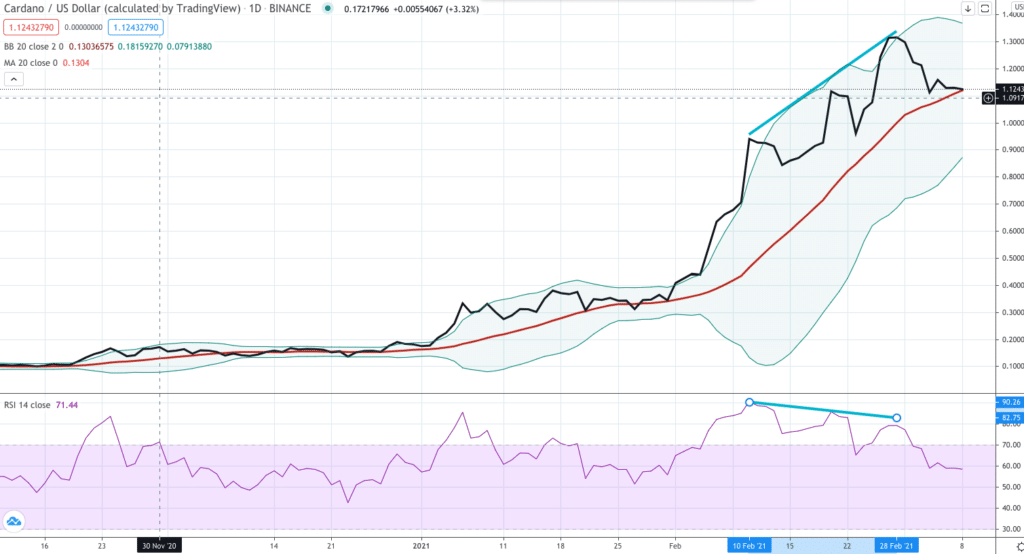
So as you see above, the RSI is seen in the bottom of the screen. It is a separate chart which equates the price into a scale ranging from 0 – 100. Very simply it calculates this value based on two factors
- Average gain or loss during the period in question
- The number of these gains or losses
So the RSI will increase when the number and size of positive closes increase. Alternatively, it will decrease when the number and size of losses increase. (This can be difficult to understand. If you can’t wrap your head around it, do not worry. All you need to do is see how to use it).
How do you use it?
- If the RSI value is higher than 70, the price of the cryptocurrency (or any other asset) is high
- If the RSI value is lesser than 30, the price of the cryptocurrency is low
Another way of using this is comparing the move of the RSI to the move of the price. Have a look at those two bold blue lines in the chart. There’s one moving upwards on the price chart (on top) and there’s another moving downwards (on the RSI chart at the bottom). What that means is while the price of Cardano, in this case, was moving higher, the RSI was making lower highs – so there was a divergence. For a trader, this would be a signal to probably sell.
Try your hand playing around with some of the technical indicators. It’s fun and you’ll maybe just figure out what works best for you. Or you might even discover some new combination that works best.
Again there’s no hard and fast rule in technical analysis. There’s no rule that “Oh I followed it exactly. I am guaranteed success”. Please do not think that. You will definitely fail. Use technical indicators as a guidance. But remember the market has a mind of its own. Again it’s like the ocean – you can be the best sailor, know all possible sailing and navigation techniques, but the ocean, the waves are the boss and you ought to respect that.