
This is a follow up to my Technical Analysis posts. Talking about another widely used indicator in trading, called Fibonacci Retracements. Am going to be looking into a cryptocurrency called ALGORAND using this indicator.
Before that, a big thanks to AG Hunter – Cryptocurrency and Finance. Decided to do this post and look into ALGO thanks to a chat with him and some of his coverage on it. Do check out his channel. Great content. He’s been pretty bullish on ALGO for a while. A video he did covering the fundamentals of Algorand is linked within this post.
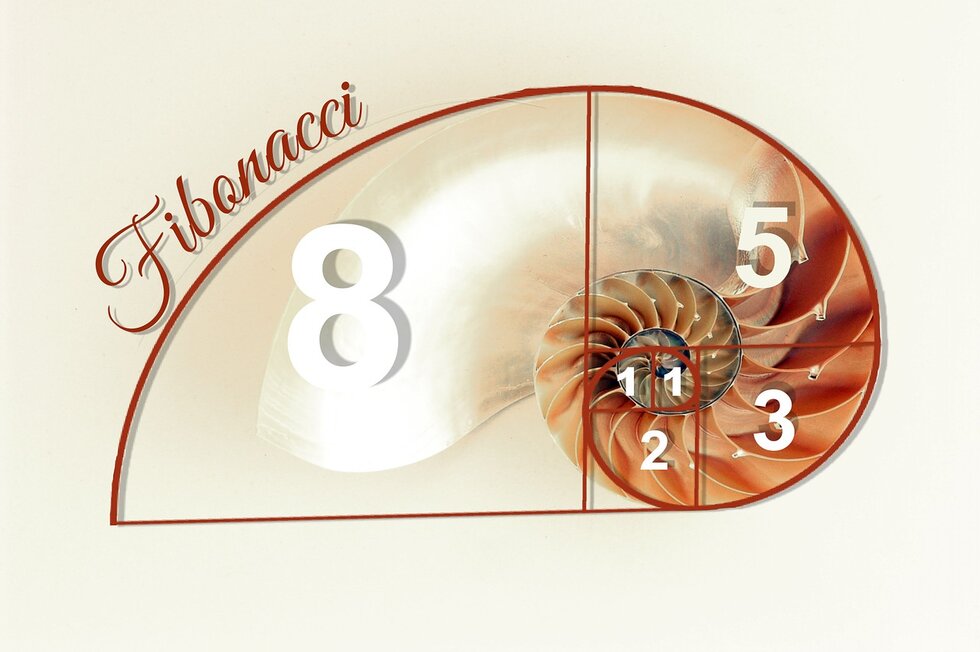
What are Fibonacci numbers?
Have a look at these numbers and tell me if you see any kind of sequence. Still better, tell me if you can guess the next number in the sequence.
0
1
1
2
3
5
8

Guesses? Well, it’s 13. How do we get that? Each number is found by adding up the two numbers before it. So the 3rd number (1) = 0 +1. The 4th number (2) = 1+1.
Finally the number I asked you to guess, 13, was 5+8. Also, the sequence goes on like this.
So this sequence was put forth by an Italian Mathematician a few hundreds of years ago. He was called – Leonardo Bonacci, Leonardo of Pisa, or Leonardo Bigollo Pisano – and came to be known as Fibonacci. These numbers have since gotten quite a level of mystery to evolve around them and there have been instances cited to show how they appear all around us. For example, and I’m using an external source here, the number of petals of flowers reflects the Fibonacci sequence. Most flowers have three (lilies and irises), five (parnassia, rose hips) or eight (cosmea), 13 (some daisies), 21 (chicory), 34, 55 or 89 (asteraceae). I haven’t counted these and don’t plan to. The idea was to just give you some perspective.
How are Fibonacci numbers relevant to trading?
I’m going to get into some maths here. Take a look at the sheet. If number are not your thing, do not worry about this. Just skip to the next section.
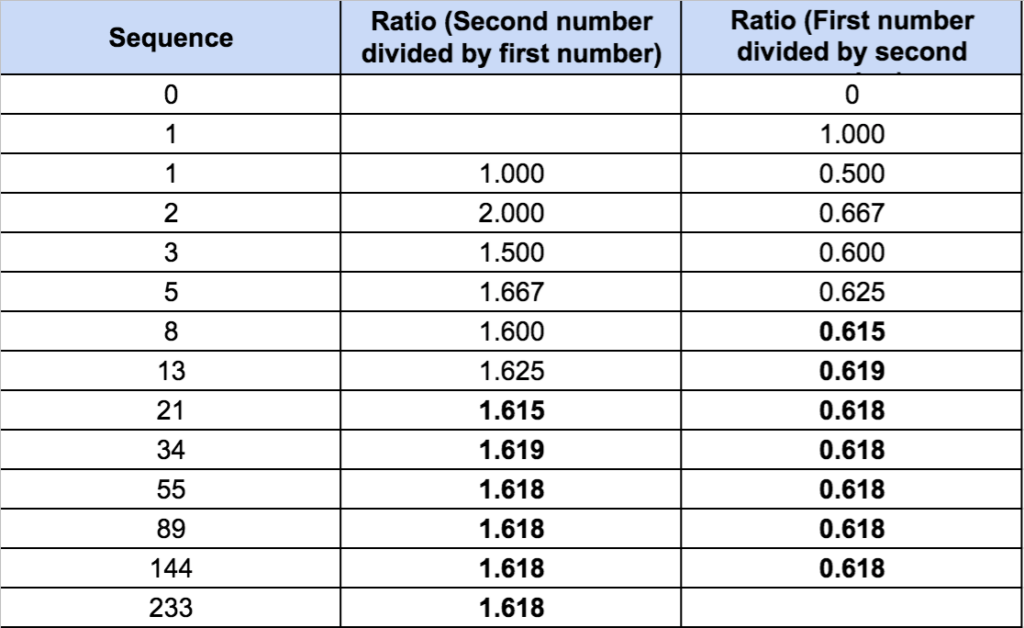
So if I divide the numbers in this sequence there’s a pattern which begins to emerge. Have a look at the second column. That’s a column consisting of a ratio where a number is divided by its predecessor. So basically the last 1.618 =233 / 144. What begins to appear is a common number 1.618.
The third column does the reverse. So the last number here 0.618 = 144 / 233. Again as you see there’s a common number that appears there, 0.618 or 61.8%.
So in the case above, we were dividing each number by the number immediately ahead. Take that step further and you can divide each number by the number that is two places ahead, three places ahead, and so on. Based on this, we get six key retracement levels. This is what you use in trading.
0%.
23.6%.
38.2%.
61.8%
78.6%.
100%.
Using Fibonacci in crypto. A look at Algorand
Like I said earlier, this post is focused on the technicals for $ALGO, especially the use of Fibonacci retracements. But if you’re interested in knowing more about the project, here’s a video
So, here’s the chart for Algorand. It’s a simple line chart for the price of ALGO over the last six odd months,
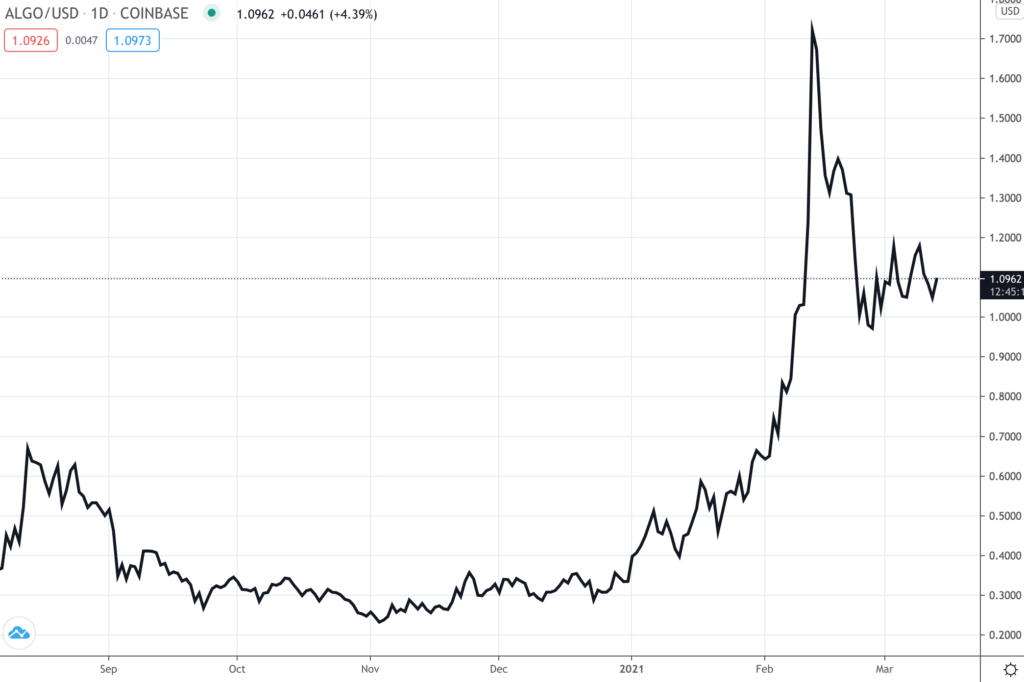
Now, as you see, it try and use the Fibonacci Retracement levels (spelt out earlier) of 0%, 23.6%, 38.2%, 61.8%, 78.6% and 100% on this chart. Obviously the easiest thing for me to do is plotting 0% and 100% – this is the beginning point and end point of a trend – upwards or downwards. So in this case, as you see Algo began an uptrend around November which touched a high of that move in February. So those are my 100% (beginning of the move) and 0% (completion of the move).
So using Trading View (it’s got a Fibonacci Retracement tool), I connect the bottom and the top, and the tool helps pull out the rest of the levels. This is how it looks,
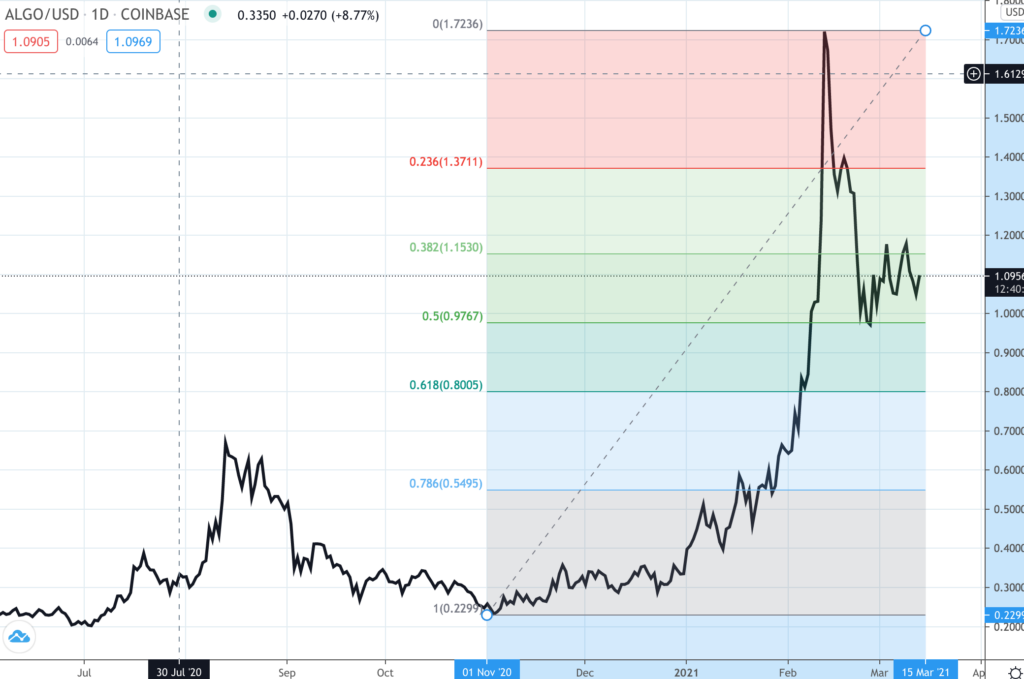
So as you see it has drawn different retracement levels within the broad upmove.
Common Fibonacci levels followed in trading are the 38.2% and 61.8%. So if the 38.2% gets taken out, there’s a chance the price will head to the 61.8% before there a reversal of move, and the uptrend continues. Some debate the use of the 50% – I personally have seen that work too, and I like using it as a level.
In the case of ALGO, you see how the price took support off the 50% level and has been consolidating sideways.
This is just the basics and there’s loads of theories and strategies around this. So I’d suggest you spend sometime here playing around with some charts, try out some Fib levels, here.
Again, use this along with other technical indicators
I’d spoken about Bollinger Bands and RSI in another post. So I’ll use that here,
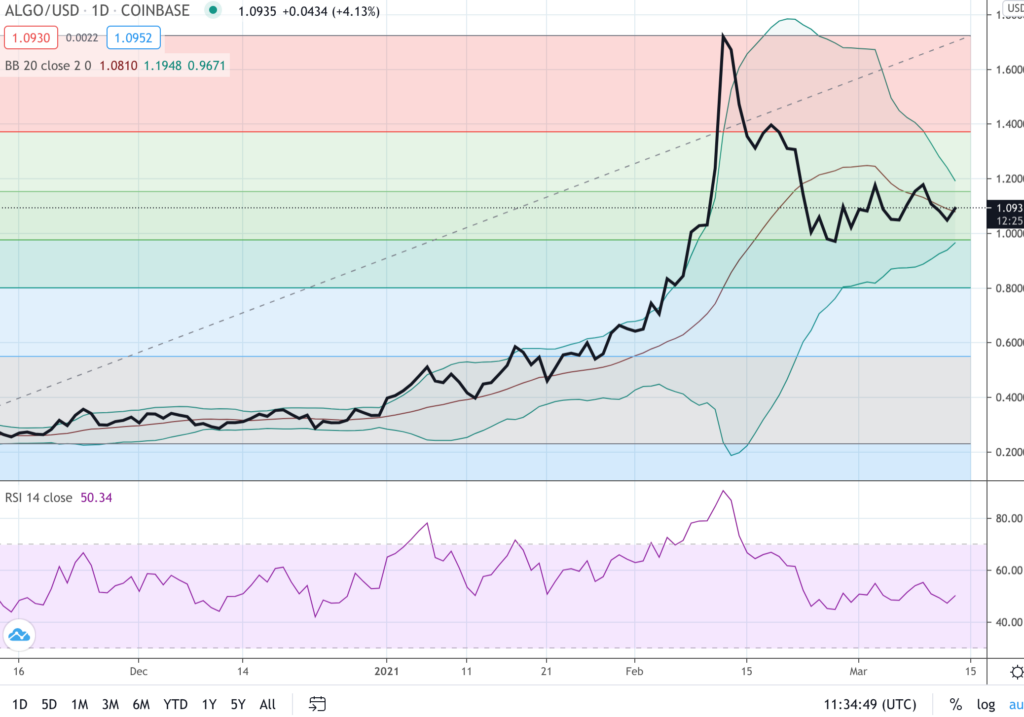
What I am seeing is,
- Fib support at the 50% levels
- Price has been consolidating in a range of $1.00 to $1.20 since somewhere around the second half of February 2021
- The Bollinger Bands are narrowing, meaning a period of high volatility may be on the horizon. This to me could be an upwards move.
- RSI is closer to an oversold level.
- If I were to be buying this, I’d have bought may be 50-70% here and keep the rest incase this were to go down and test the 61.8% levels ($0.80).
- Looks good overall. As always, do your own research.