

Why the featured image? It’s supposed to indicate momentum (couldn’t figure out what better) and the MACD is a momentum indicator.
Treat this post as a follow up to my earlier ones on technical analysis. Here’s a list in case you haven’t had a chance to check them out,
How to use Fibonacci Retracements in crypto trading? (A look at $ALGO)
Top 3 technical indicators for cryptocurrency trading
A beginners guide to Technical Analysis
Covering the Moving Average Convergence Divergence indicator here, also known as MACD. Since the workings behind this indicator can be a little complicated, I’ll begin off by sharing a chart showing it. I’m choosing to overlap this indicator on a cryptocurrency called DOT (Polkadot) – I’ve recently been moving some profits from other coins into this. I shared this in my latest newsletter – so if you do want to stay on top with what’s happening on this site, besides some interesting insights, do consider subscribing. I promise not to spam you with crap
Coming back. Here’s the chart for $DOT. This is sourced by TradingView and traces the price of DOT for the current year so far. It’s a simple candlestick chart on the top, with the MACD indicator plotted beneath.
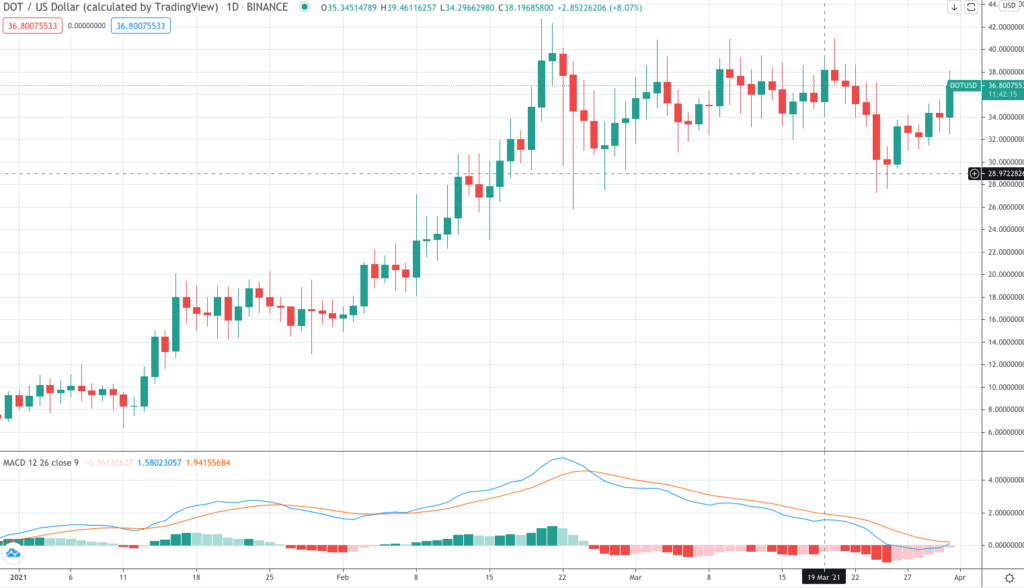
As you see, the MACD is made up of three things
- a red line, called the signal line
- a blue line, called the MACD line
- a histogram, called a histogram 🙂 plotted on the base line (0 line)
What are these?
Before we get into that, it helps to know what is a moving average. I’m quickly repeating what I’d used for an earlier post.
Let’s say you’ve given an exam consisting of 5 subjects – Mathematics, Science, English, History and Geography. You scored as follows, (to end up with an average score of 72)
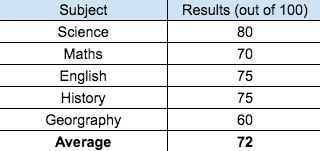
Let’s plot this on a chart,
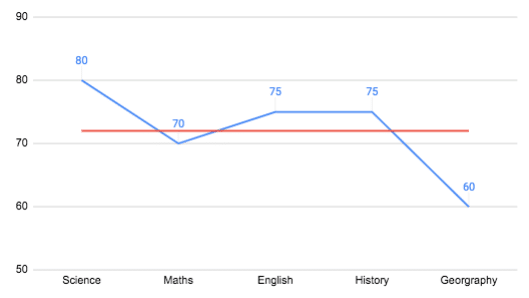
Now say you take another exam. This time in Literature, where you end up scoring 50 (yes, you’re bad in literature). So we now update the chart to accomodate the new subject,
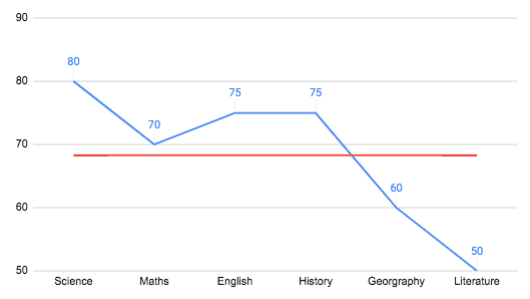
Your new average score now is 68.3. So the average line has moved from an earlier 72 to a 68.3. This is a moving average line.
For a cryptocurrency, this would be the average of the closing prices for each day over a certain period. Given the price fluctuates every day, the moving average would change in the same manner.
Let’s assume, you’re applying to a college for admissions into a Physics program. So of the subjects listed above, a higher weightage to determine entry to the program may be given to the scores obtained on Science, Maths and English.
The equivalent of this with crypto prices takes us to the concept of EMA or Exponential Moving Average. An EMA gives higher weightage to more recent prices. So to distinguish, SMA or Simple Moving Average assigns equal weight to all values while an EMA or Exponential Moving Average places higher weightage on recent prices.
MACD is based on the EMA.
- The blue line, or the MACD line, is calculated by subtracting the 26-period exponential moving average (EMA) from the 12-period EMA. This maybe complicated so you could skip it, and just stick to what it signifies. The MACD line helps determine upward or downward momentum, specifically the market trend.
Have a look at the chart of DOT I posted above. Note how the price of DOT has been rangebound since the latter part of February while the MACD line (blue line) was moving downwards. It has most recently made what looks like a bottom, reversing that downwards trend. Possibly. - Then, there’s the signal line, the red one. This basically is the EMA of the MACD line (blue line). This functions as a trigger for buy and sell signals.
When the blue line (MACD line) crosses the red line (signal line) from the bottom and moves up, that’s a signal for a buy.
When the blue line (MACD line) crosses the red line (signal line) from the top and moves down, that’s a signal for a sell.
Go back to the chart and see how this has worked previously. See where these lines are now. What I’m seeing currently is the blue line trying to make an attempt to cross over the red line and move up. Buy? Probably. It would be interesting to see how this plays out. Posting just the MACD part of the chart above here,
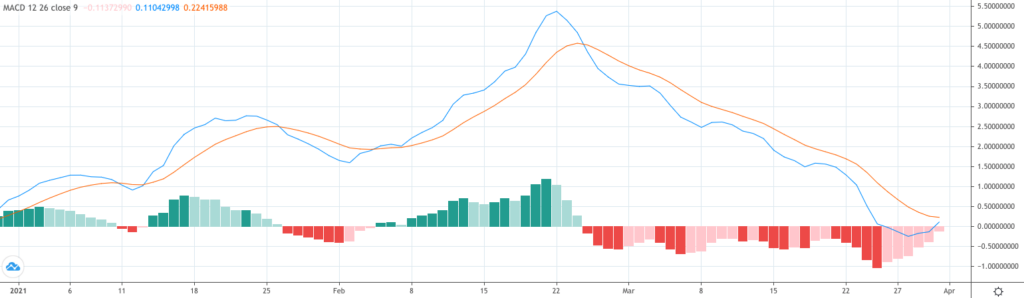
- Finally, there’s the histogram. This is based on the differences between the two lines. Have a look and you’ll notice that when the two lines (blue and red) are far apart, the bars on the histogram grow bigger and when the lines are closer, the bars grow smaller. When the blue line is above the red line, the bars are green and above the 0 line (base line) and when the blue line moves below the red line, the bars turn red and are below the base line. The histogram is used as a quick reference to identify when bullish or bearish momentum is high.
That’s it. You’re now acquainted with another technical indicator. Try it out and get an understanding. One final word of caution. Do not take any indicator as the final word or commandment. Nothing is guaranteed in the markets and technical indicators can even produce false reversal signals – basically meaning the indicator can signal a possible reversal but then no reversal actually happens. So while it is showing a possible reversal on DOT, it may not happen either. It helps to use different indicators together and figure out a signal.
In summary,
- Work with different indicators together and get a feel
- Don’t be in a rush to get into a trade
- Know the difference between trading and investing
- Try these out with different charts. The more you see, the better a feel you will develop